-

FOSS4G is the open source conference of the geo community. -

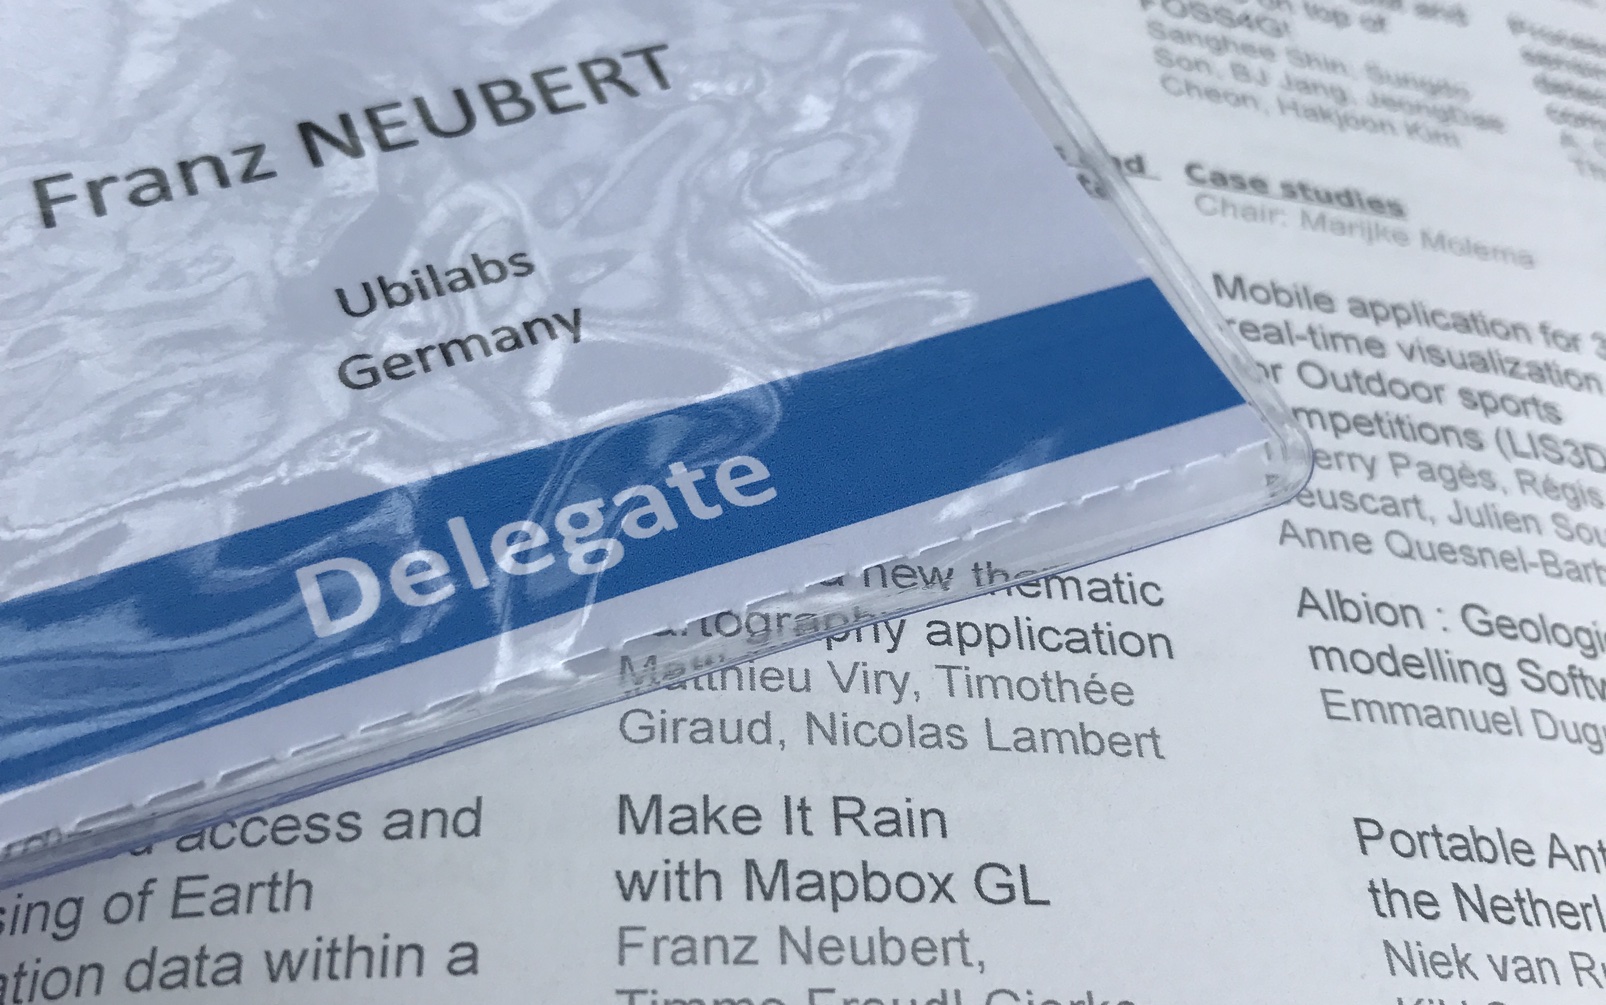
Franz Neubert shares his insights from a MeteoGroup project, for which he visualized weather data with Mapbox GL. (Source: Jorge Sanz, @xurxosanz) -
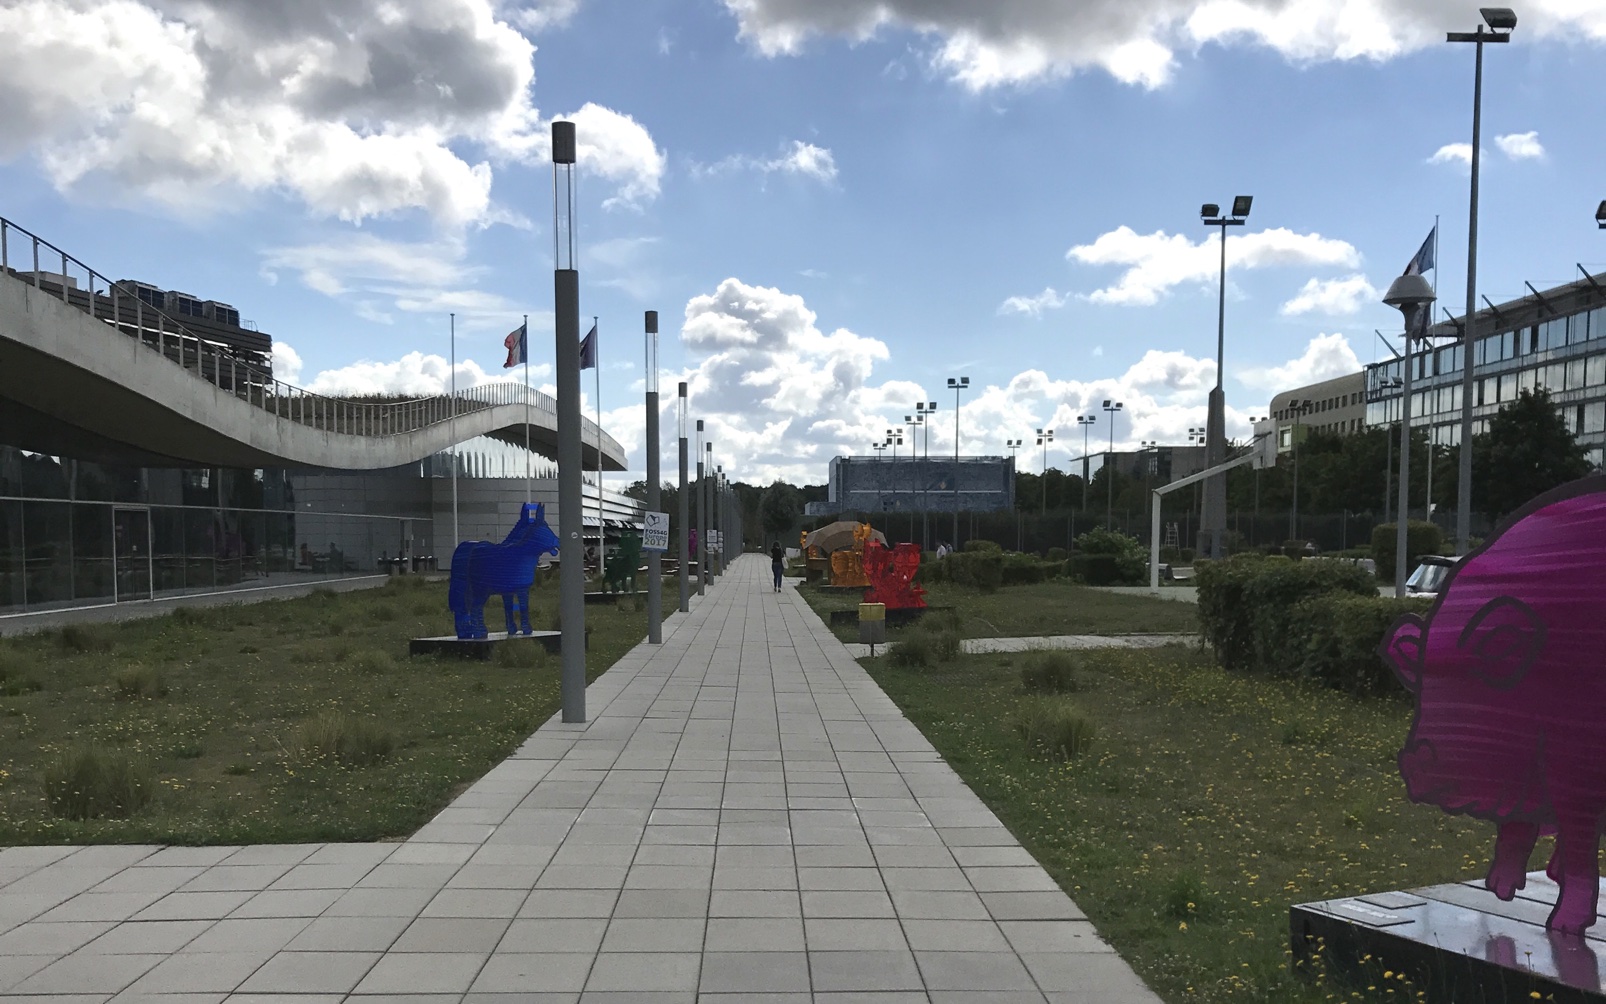

FOSS4G Europe 2017 took place at Ecole Nationale des Sciences Géographiques in Paris from 18-22 July.


Making it rain: Franz Neubert at FOSS4GE 2017
FOSS4G Europe 2017 is the third installment of the open-source geospatial event series, which took place in Paris from July 18-22. Ubilabs’ front-end developer Franz Neubert mingled with the GIS community to find out about the latest geo trends and to share his insights on visualizing weather data.
Hi Franz, you attend conferences quite often. What’s different about the FOSS4G Europe 2017?
Working as a front-end developer, I usually go to events that focus on front-end topics. At FOSS4G, GIS and open source are key, that’s a completely different focus, resulting in different approaches and talks. It’s been a really nice change of routine for me.
What were your conference highlights from a front-end perspective?
I really enjoyed CARTO’s talks during which they presented their BUILDER in some greater detail. I saw a first demonstration of it during GeoNight in Hamburg a few weeks ago where Tim Marston from CARTO was a guest speaker.
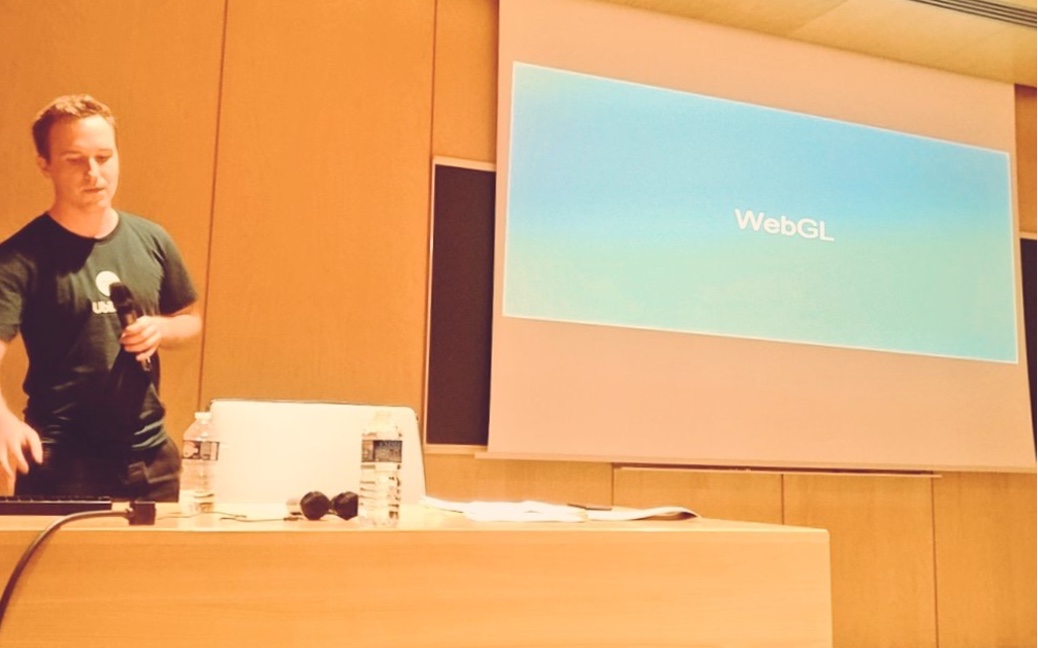
Apart from that, I was a bit surprised that WebGL wasn’t talked about much more. It’s already being used very successfully in other front-end fields and I see a lot of potential for GIS as well. I hope my talk showed how much this technology has to offer.
That’s right, you had a speaker slot at FOSS4G on Wednesday where you presented one of the projects you’ve been working on at Ubilabs. What exactly was your talk about?
For MeteoGroup we visualized weather data with Mapbox. In my talk “Make it rain with Mapbox GL” I described two concepts that we worked on during the project. One was about the flexible colorization of map tiles in the client and the other one about the question how to transmit and render huge amounts of grid data efficiently.
What were the biggest challenges during this project and how did you solve them?
The major challenge was that the project raised a lot of questions for which there were no standard answers yet. We really had to start from scratch with this project, which was fun. We did a lot of research, concept development and testing. We also pushed the Mapbox GL JS Library to its limits and had to create the functionalities we needed in order to continue with the project.
What’s the current project status? And are there other Mapbox projects in the pipeline already?
The MeteoGroup project is still going on with a few bug fixes and new features here and there. But we already cracked all the tough nuts. Whether we will have more Mapbox projects coming soon is not up to me, but I’d be more than happy to be working on them!