From Legacy BI to Looker: Why Migrating to a Modern Data Platform Pays Off
Interview: Answers to the most frequently asked questions about Looker
Many companies are hitting a wall with their existing BI solutions, whether it's SAP Business Objects, Power BI, or Tableau. Data silos, outdated data exports, and a high dependency on IT prevent agile, data-driven action. Migrating to a modern platform like Looker is the logical next step.
But what does Looker do better than legacy tools? And how does the switch succeed? In our interview, Ubilabs expert Philipp Wedekind explains the key benefits of Looker and why Ubilabs is the right partner for a successful BI migration


Philipp Wedekind is the Technical Lead of the Looker Customer Engineer Team at Ubilabs and also serves as the strategic planning contact for our Looker clients. He deals with complex requirements and provides realistic assessments of project feasibility.
He guides interested companies through two-week Proof of Concepts and plays a leading role in migrating complex BI landscapes to Looker. Following migration, he remains a key contact for tool implementation, training IT staff on the client side, and handling individual requests such as specialized visualizations.
Since when have you been working with Looker?
When Google acquired Looker in 2019, Ubilabs immediately recognized the potential. We were convinced that the platform – especially through its scalable semantic layer – offered enormous added value.
That’s why we became one of the first official Looker partners in the DACH region and became certified LookML Developers. As a Customer Engineer, I have spent several years accompanying clients either in setting up their Looker instances from scratch or planning and executing the migration of complex BI landscapes with them.
Who is Looker suitable for as a BI solution?
On the one hand, Looker is suitable for companies where data activation is already a central focus today. These companies usually recognize the value Looker delivers very quickly. On the other hand, there are companies just embarking on this path, where Looker is intended to be part of a larger, company-wide cultural shift toward data-driven decisions. Looker as a technical solution cannot bring about this change alone, of course, but I have witnessed it supporting this transformation massively as a tool.
Looker is also particularly strong where a relatively small data team needs to supply large workforces with sometimes very different needs with data. In such contexts, Looker benefits from the fact that it was designed for exactly this from the start: to scale excellently. Furthermore, Looker is a great choice when governance is a high priority, yet a fast time-to-value is desired.
Many companies have been using established BI tools like Tableau or Power BI for years. Why is the effort of migrating to Looker worth it?
These "legacy" BI tools are reaching their limits with demanding business clients and their modern requirements. We usually see four core problems with our customers:
- No Single Source of Truth: These tools often work with data extracts. Although investments were made in a data warehouse, reports are pulled from there into Excel or similar tools and processed manually. This leads to data chaos because departments report different numbers for the same KPI. Governance is missing.
- Lack of Scalability: Performance drops with very large data volumes because most tools do not work cloud-natively on the data warehouse. Heavy lifting simply must happen in the database once a certain data volume is reached.
- The Analyst Bottleneck: True self-service analysis is often barely possible for business users without SQL knowledge. Specialist users have to submit a ticket to data analysts for every adjustment to a report.
- Lack of Integration: Data is "trapped" in internal dashboards. This means: I see the data, but to derive actions from it, I have to switch tools, copy/paste tables, or something similar. Another point is embedding: Integrating dashboards into applications already used by end-users – bringing data to where the users are – is more mature in Looker than in any other tool.
Looker solves this through its architecture. The migration is therefore not just a tool change, but a modernization of the data strategy. Looker creates a central single source of truth via the LookML layer and works live on the database. Building on this, it enables governed self service, which relieves data teams.
Additionally, data from the entire platform can be retrieved exclusively via the API and delivered to other applications. This ensures that these applications use live data that follows the currently valid business logic.
And the most important point for the future: Only this Semantic Layer makes company data AI-ready. It grounds AI models like Gemini and ensures that Conversational Analytics is based on trustworthy data. This is a strategic advantage that legacy tools do not offer. We do Proof of Concepts with many clients because they are interested in exactly this: How can I use the benefits of AI on my data without getting unreliable output ("hallucinations") or exposing data content to people who don't have access rights? Looker's architecture is made for exactly these requirements.
Can Looker integrate with existing systems, even outside the Google Cloud?
Looker is cloud-agnostic, meaning it can be seamlessly linked with databases from all major cloud providers. In the best case, the database "speaks" a SQL dialect, but NoSQL databases are also supported. It is also possible to merge and blend data from different databases, different cloud providers, or on-premise databases within Looker.
This openness is a significant advantage over competitor products that force customers into a strategically intended vendor lock-in. Nothing has changed in this regard since Google acquired Looker – an acquisition that cost Google over $2 billion, by the way. Though, of course, they are happy if you use Google databases like BigQuery under the hood.


Do end-users need specific technical knowledge to use Looker?
No, and that is a core benefit that solves the dependency on the analyst bottleneck. Looker end-users do not require SQL knowledge. The Standard User works primarily with pre-built dashboards, where Conversational Analytics (Gemini in Looker) simplifies access massively: The user can ask questions in natural language and receive direct answers.
For more curious users, there is Looker's Explore environment to explore data independently and build dashboards. AI supports here too: The Formula Assistant helps create complex calculations without the user having to write code.
Additionally, Explore users can rigorously test the AI: Every result delivered in the chat can be scrutinized with a click. Looker then switches from the chat to the familiar Explore interface and essentially demonstrates to the user how it arrived at the answer: which model was used, which dimensions, filters, and measures. This ensures that for critical information, the source and derivation remain verifiable. All user levels thus benefit from AI to reduce barriers in self-service.
What types of visualizations can be created in Looker?
Looker offers a broad repertoire of standard visualizations like tables, bar charts, or waterfall diagrams – most of which are familiar from other BI tools. The decisive point here is also the simplification through AI: With the Visualization Assistant (part of Gemini in Looker), users can create or adjust visualizations via natural language, which enormously accelerates the self-service concept.
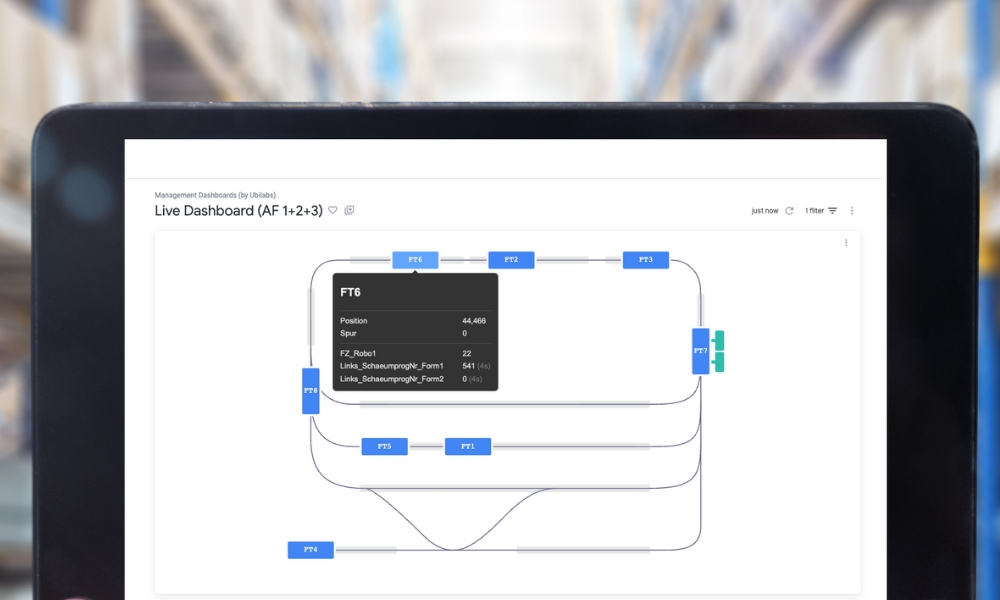
For completely individual requirements, the possibilities go much further: Looker uses Highcharts for rendering visualizations. Anyone familiar with it knows: Almost everything is parameterized if you have very concrete ideas about how a tooltip should behave, or similar. But it also works completely freely: For Fehrer Automotive, for example, we built a complete visualization of their production hall as a dashboard tile, where users can view the location and status of robots live. This basic repertoire is therefore freely extensible via Javascript if needed.


How secure is my data when I use Looker for my business?
The data stays where it was before, for example, in the data warehouse in Frankfurt. It is nowhere permanently cached, as is often the case with other systems that work with pre-aggregated data. Of course, there is caching for performance and cost reasons, but this is finely configurable. In the cloud-hosted variant, companies can also determine which cloud provider and which data center their Looker instance should be hosted in.
For highly regulated data that must not leave the premises, such as in banks or hospitals, it is also possible to self-host Looker. In this variant, Looker runs on local hardware, with all the pros and cons. However, we can recommend the cloud-hosted variant to most customers with a clear conscience.
Why should customers use Ubilabs for implementation or migration?
Customers who implement Looker projects with us – especially complex migrations – simply benefit from our experience. They pay us so they don't have to make every mistake themselves that one inevitably makes when carrying out such a project for the first time.
- Expertise: As one of the few German-speaking Premier Partners in DACH, our employees are experts in LookML. They understand not only Looker but also complex data models in the underlying data warehouses. And they have to: Without understanding the data structure sufficiently well, you will run into problems.
- Translation: The other end is the business user: Capturing their requirements cleanly is an art in itself. Often, they cannot formulate their wishes sharply themselves. At this "translation threshold," a lot of experience is needed so as not to "build past" the business users' needs.
- Strategy: We also advise strategically: As a long-standing partner, we receive early insights not only into upcoming Looker updates but also into broader market developments, and can align our clients' data strategy to be future-proof.
- Holistic Approach: We bring expertise in the entire Google Cloud Data Stack, especially Google BigQuery. Our experience ranges from "pure" Lift & Shift migrations of hundreds of reports to designing data-as-a-product solutions to monetize data.
An often-overlooked point is that this service means no financial extra cost. Our customers pay the same price as they would with Google directly; our work is compensated by Google – a true win-win-situation.
Do you still have questions or are you interested in a proof of concept?
Feel free to contact us directly to get in touch with our Looker specialists.