How are BigQuery, Data Clean Rooms, and 300M POIs transforming location intelligence? Our Google Maps expert Philipp Lauser answers the most critical questions about Google’s Places dataset for strategic data analytics.
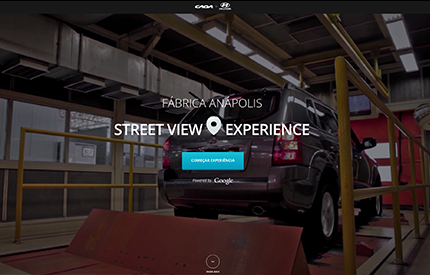
The Google Street View Tour will give your customers an inside look of your premises. The CAOA Hyunday factory in Brazil used the tour to give an exact idea of their manufactoring process. Consumers and other stakeholders require more and …
370 participants, 28 talks within two days and three get-together parties: This year JS Unconf reached a higher level. We are really proud of our team – Robert Katzki, Martin Kleppe, Philipp Hinrichsen and Frank Mecklenburg – that played a major role in the …
Our top links of the week will tell you more about your surroundings: whether it regards New York City’s past or music album covers in real life. Have you explored Nasa’s Data portal yet? On this site you will find a continually …
Look up regional farmers markets in Germany, what NYC was like in the 90’s and be surprised by the exact coverage of each tree in Hamburg. As we are fans of Mount Everest and the surrounding region (like Khumbu), we want to share this interactive graphic …
Google has opened the doors to the iconic Abbey Road Studios in UK, the most famous recording studios in the world. Watch the recording of the Star Wars soundtrack (in Studio 1) and have a look at Studio 2, where The Beatles, Oasis oder Adele recorded some of …
Auto-formatting with JSCS or a visualization of landscape data, five links that will teach you: nothing is impossible. 1. Auto-formatting JavaScript Code Style: JSCS is a code style linter for programmatically enforcing your style guide. There is a new …
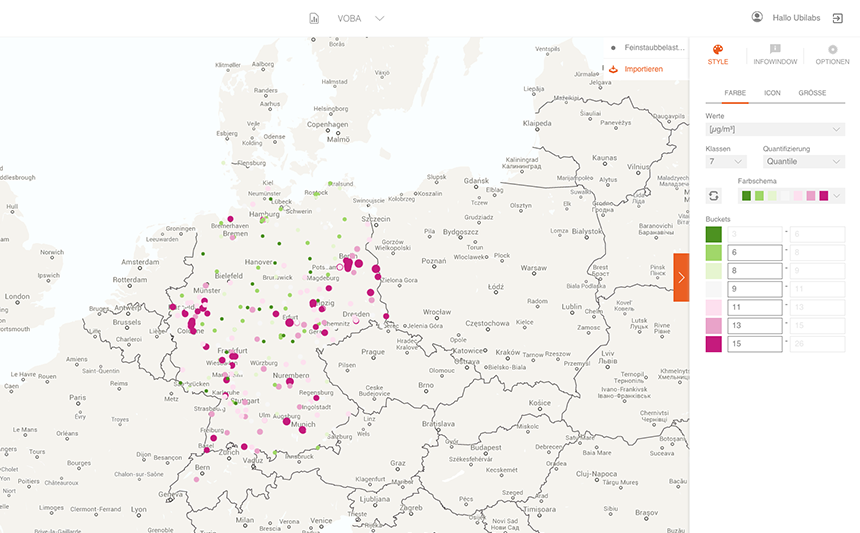
Data visualisation is an easy and effective tool to present correlations. This map shows, how easy it is to get a simple answer to a complex question. In this map you can see locations with highlevels of air pollution in Germany. The data comes from a …
This week’s links will take you on a trip around the world. Spotimap will accompany you by playing the right song and Tom Deniss will show you how to have the work out of your life by visiting 18 countries on a run. Are you looking for a song which …
In 2007, four friends decided to found a small enterprise: Ubilabs. Today we are a team of nearly 30 – upholding the spirit of a start-up combined with experience from eight successful years. Wow, time flies! Eight years ago, four friends …
Art within reach: The Google Art Project enables to take a close look at street art around the globe. From the talking walls of Buenos Aires to Berlin’s East Side Gallery, explore more than 10,000 street art images. Get to know the stories behind the …
Learn more
Newsletter
Get monthly updates on current projects, exciting use cases, and the latest geospatial data news delivered to your inbox.