As CEO & Founder, Alisa Türck has 20 years of experience in managing digital projects for companies. In this interview, she talks about the challenges of implementing change processes and the data needed for greater sustainability in companies.
Typos in the address, a missing or incorrect name: Inaccurate address data can have expensive consequences. Address data validation using Google Maps offers a fast and cost-effective way to correct address data and display it correctly on the map.
Multi-cloud strategies bring challenges for integrating and orchestrating data - and for governance. A recent remedy is BigQuery Omni, a multi-cloud analytics service that enables data professionals to break down data silos and analyze across different clouds securely and cost-effectively.
Our project owners Annika Bock and Patrick Mast explain in this interview why map applications have become an indispensable part of everyday life and how companies use the informative power of geographic data.
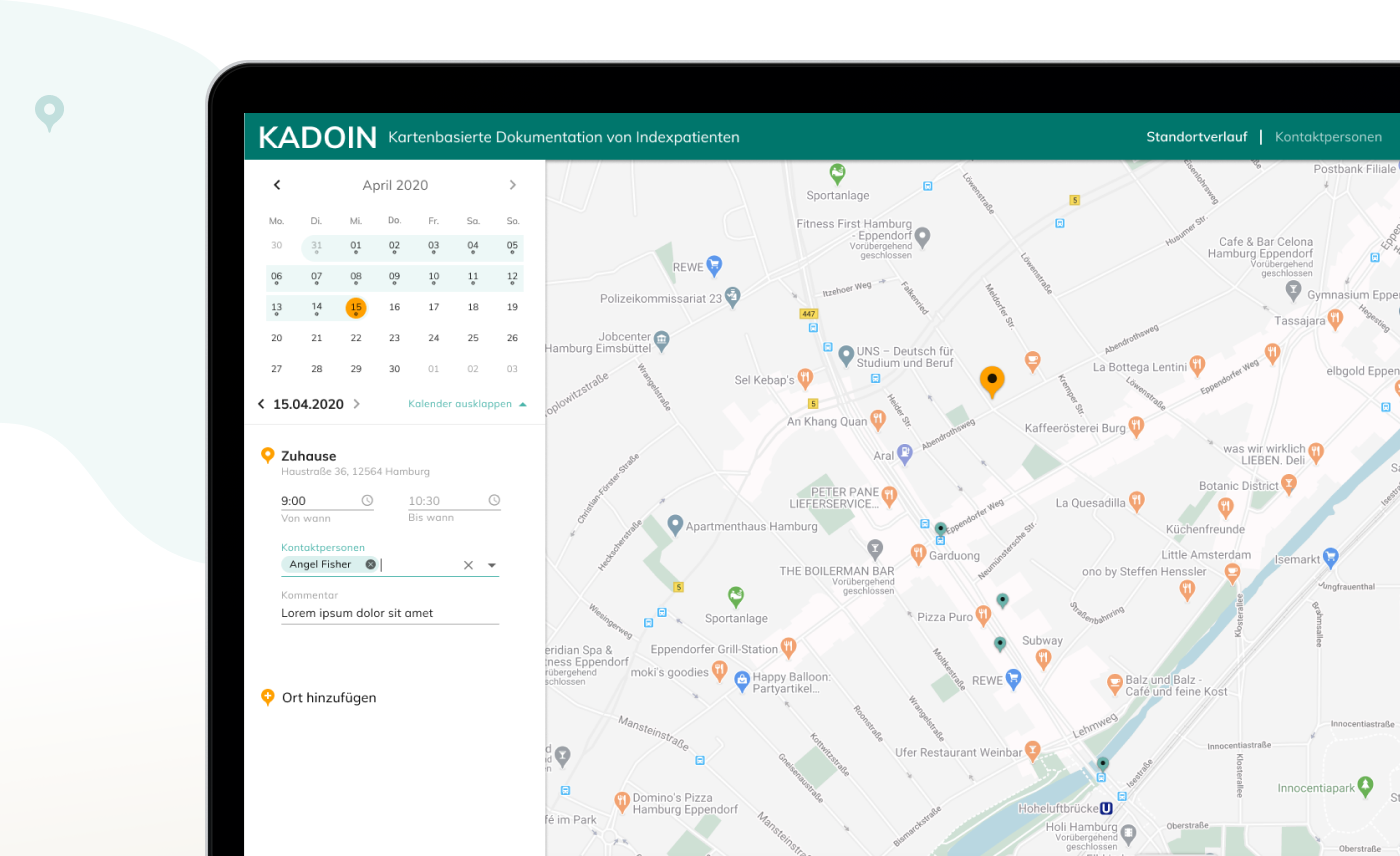
The coronavirus pandemic has posed enormous challenges and new questions to the world. How can the spread of the virus be contained? How can health authorities work more efficiently and how can infection chains be broken? Our response: KADOIN.
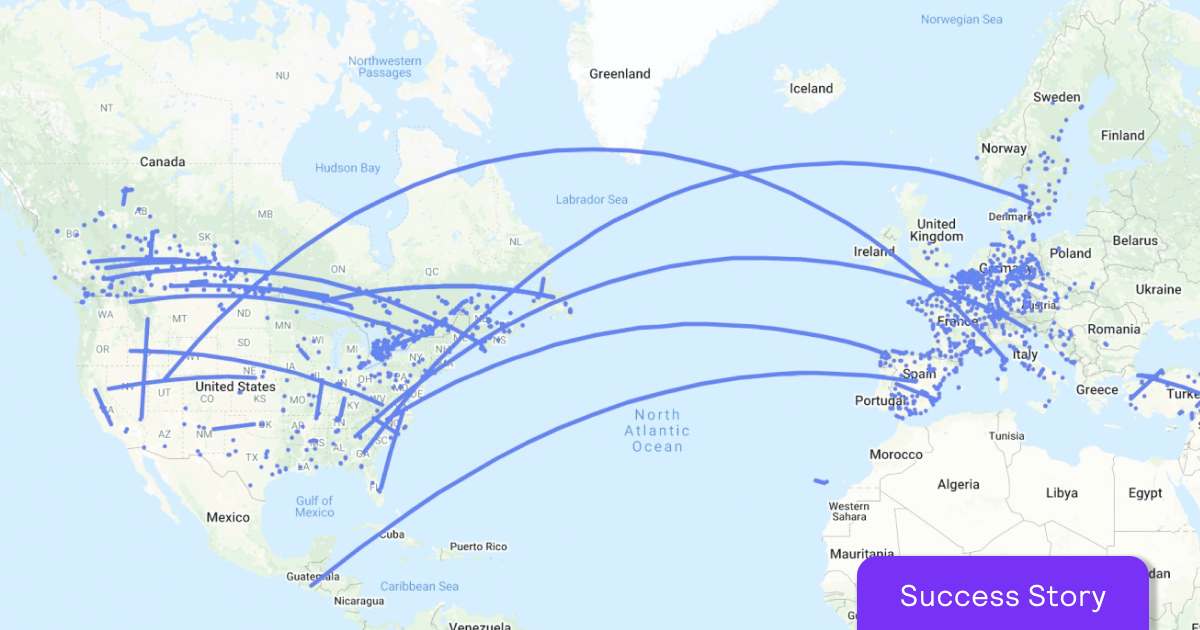
Ubilabs has successfully completed the Data Analytics Partner Specialization in the Google Cloud Partner Specialization Program. With this, Ubilabs has proven its expertise and success in developing customer solutions in the field of data analytics using Google Cloud Platform technology.
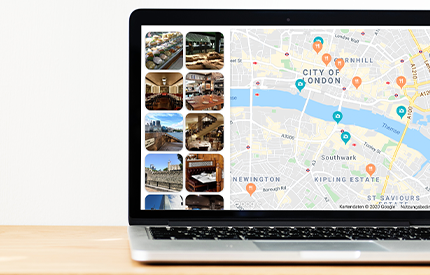
Which customer does not want to know in what kind of neighborhood his future home or the booked hotel is located? Previously a complicated switch between different websites, the new Google Maps feature Local Context makes it easy: local information can …
The Corona crisis forces us to rethink physical space and our knowledge of it. Hot spots, distances, propagation, extent and proximity. Suddenly we have to consciously think about the "where" of it. It has become essential for us to know which …
Learn more
Newsletter
Get monthly updates on current projects, exciting use cases, and the latest geospatial data news delivered to your inbox.