
For more than fourteen years Ubilabs has been working for international companies, developing applications at the interface between data and maps. Our project owners Annika Bock and Patrick Mast explain in this interview why map applications have become an indispensable part of everyday life and how companies use the informative power of geographic data.


Annika Bock has been working with Ubilabs for seven years. As a project owner, she is the main point of contact for the customer, supporting them with concepts and consulting. Annika leads a team of developers with whom she primarily implements frontend projects in the area of interactive maps.
Patrick Mast has been on board as project owner and team leader since June 2015. Together with his team, he implements challenging projects in the field of data visualization and data processing. Through his studies of artificial Intelligence in Amsterdam, he also brings a technical background to the table.
You work with customers like ARD. What solutions can they expect?
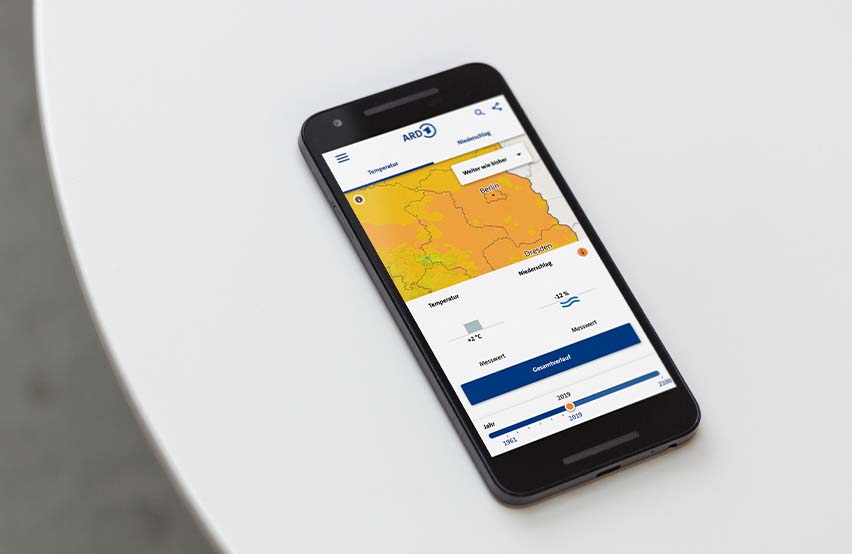
PM: Customers primarily come to us with projects and questions about the presentation and processing of geographical data. They have data that needs to be presented in such a way that people can experience and explore it. We also visualize weather data for customers or implement projects in the area of route optimization. The ARD (German television network) wanted to build a platform which displays climate data. This resulted in the ARD climate map, which is accessible to the public. We came up with the concept, the design and the user interface - and of course all the development behind it. But we also develop many projects in the field of data processing.
AB: We often get "map-specific" questions from customers, but the solutions that we develop go far beyond maps. Almost every industry now uses applications based on geographic data. As digital reflections of our world, maps are able to create a tangible reference to data. Nowadays map applications enable a digital image of our world on even the smallest mobile devices.
What are the benefits of interactive maps?
Maps have the potential to support and inspire users. They bring data to life, uncover correlations, and help companies make informed decisions.
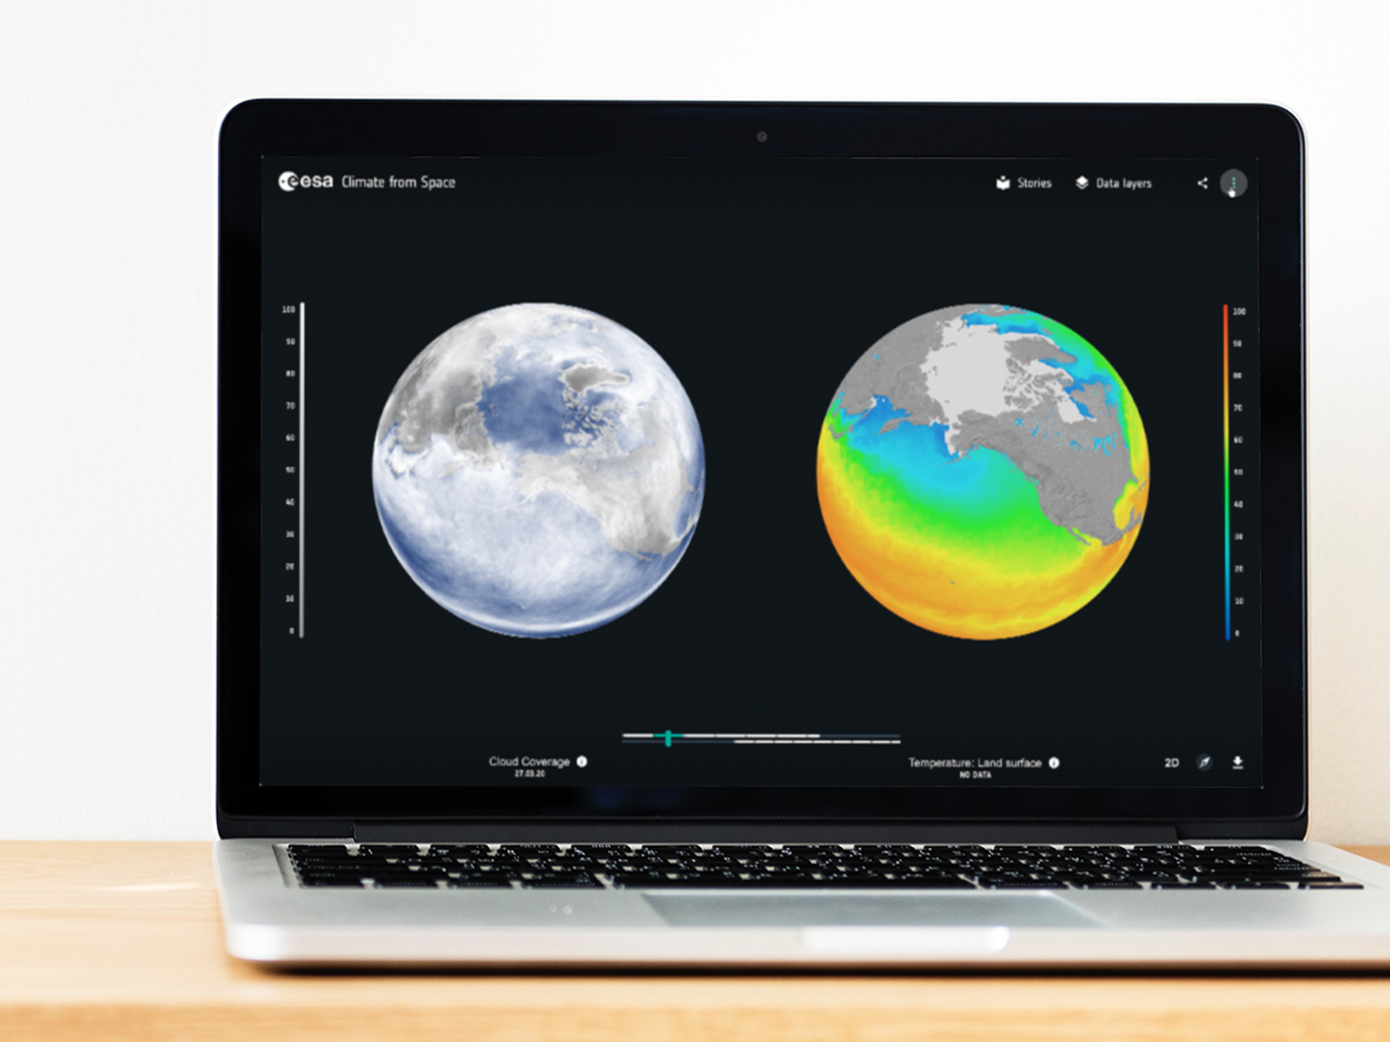
PM: When we meet a new client, we like to throw the data on a map early in the process to get an initial visualization. When we show this to our clients, you can literally hear a sigh of recognition in the room because the map puts the geographical data into context. Displaying data on a map does not only look good, it also makes the data tangible. On the map, data can be moved around, you can zoom in, or you can first approach a topic using your own location, making it easier to see connections. This is also an exciting means of conveying knowledge in an educational environment. For example, with the "Climate from Space" platform, we processed enormous amounts of satellite data for the European Space Agency (ESA) and presented it in an appealing and easy-to-understand way.

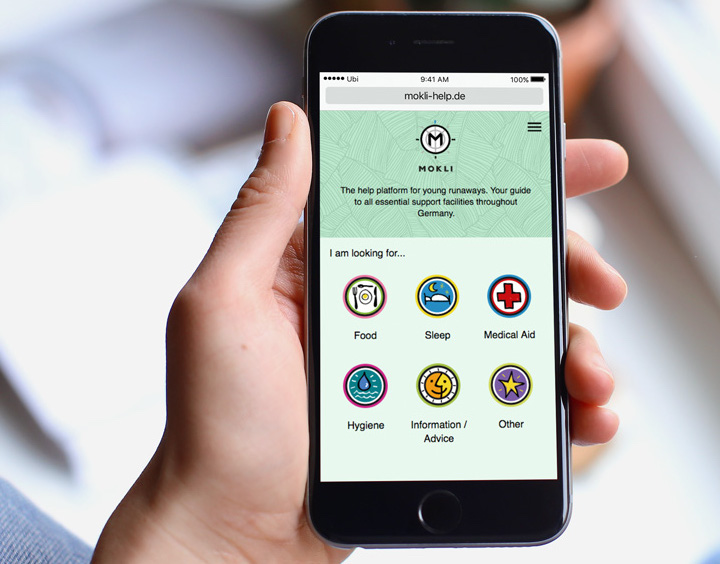

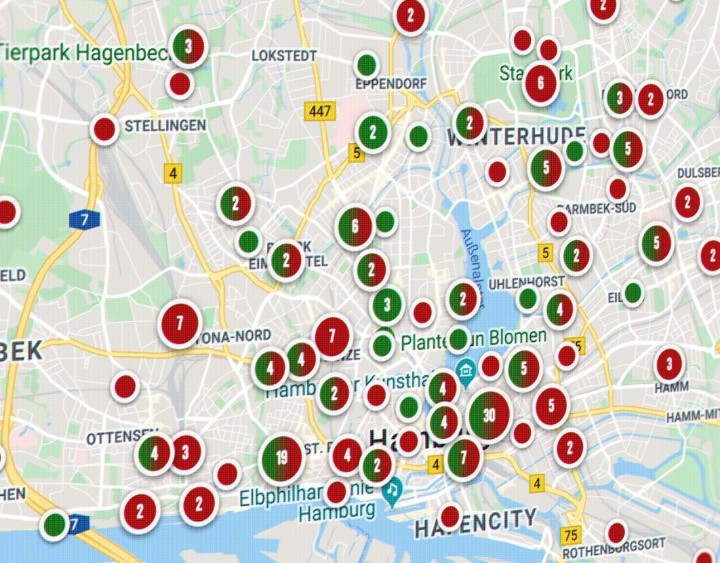

AB: The "Climate from Space" project shows how climate change affects the weather over time. Only when you see this information, such as temperatures at a certain point in time at a certain location in historical comparison on a map, do you get a connection to this data. An interactive map makes the data almost emotionally comprehensible. A community aspect also plays a role in many maps. Through contribution and commentary functions, users give meaning to certain places. This ranges from ratings of stores in the immediate neighbourhood to maps that have emerged from a community. For example, we developed a map application for the aid organization KARUNA in Berlin that helps people in need find places to sleep, eat and get medical care. For Plan International, we developed the "Safer Cities Map," on which girls and women can enter the places where they feel safe or unsafe. When places are connected to information on a map, we create a geographical documentation.
What makes geographical data special? Why do you need experts for handling the data?
PM: Geographical data cannot be translated into a map easily. The data can be represented as points, lines and areas. And it must be put into a meaningful context. In addition, reference systems and projection rules must be established to obtain a meaningful representation of the data. If you prepare them visually in the right way, you get a real gain in knowledge and can make informed decisions.
At the same time, a lot can go wrong in data preparation. For example, processing large amounts of data in a map on the website can have a negative impact on the website's performance and can slow down the page. Here our years of expertise in the field come in handy. In addition to optimal display and performance, we always consider usability in order to build coherent applications for our customers.
To what extent has the map world changed in recent years?
PM: The map world has grown up. Just five years ago, displaying more than 1000 data points on a map was challenging because it had a significant impact on the performance. Today, thanks to advanced technology, this is no longer a problem. Moreover, maps have become much more variable and offer more possibilities for design. Instead of just putting dots and static overlays on maps, today data and maps are more interwoven. The display formats and options have also become much more dynamic and flexible. 3D representations, motion and animation are no longer a problem. This year at the Google I/O developer conference, Google introduced a new API for 3D maps, for which we built two demos.
Today, maps play a bigger role in everyday life than they used to. The processing of geodata was originally done scientifically with complex geographic systems (GIS = geographic information systems). Due to the technical possibilities, we are now able to prepare complex geodata for user-friendly applications. An example of this is the Google map. Complex computing processes are happening in the background and data has to be processed in milliseconds. The geodata for the map was originally set up by GIS systems. Via Google Maps, however, this data is output as a simple map that every user understands immediately.
AB: In the past, we were competing with map applications that fell into the "my nephew programmed something for me" category. There were many quickly built, inexpensive solutions on the market. Nowadays requirements have increased and users expect even complex functions, that require complex computing processes in the background, as a given. The applications demanded today can usually only be implemented professionally in order to ensure high performance.
PM: This development has also affected our service portfolio at Ubilabs. In the past, we mainly developed solutions that focused on the presentation in the frontend. Today, we develop holistic solutions and also include backend systems and cloud services. As a Google Cloud Partner specializing in cloud computing, we can process any amount of data with high performance. We can now offer the processing of large data volumes or Big Data dynamically on the Internet thanks to improved technology.
What is your development process like? How do you find out the customer's needs?
AB: We listen carefully and ask a lot of questions. It often turns out that there is a more suitable solution to the problem presented than the customer originally had in mind. We are also very close to the customer and are always in contact. This means that we can also check during project development if we are still on track with the customer’s expectations. Our way of working is flexible and we adapt to the processes of our customers. This means that we work with different customers in different ways, which results in a good work dynamic.
PM: When we start talking to new customers, we project managers are involved early in the process of getting to know each other. That way we can test what is possible and desired from the start, give feedback and advise. When we work with new clients, we also like to use workshops to get to know them and to get a better understanding of what they want.
It is important to us to take our customers by the hand and guide them through the project development process.
What are your highlights of the last few years?
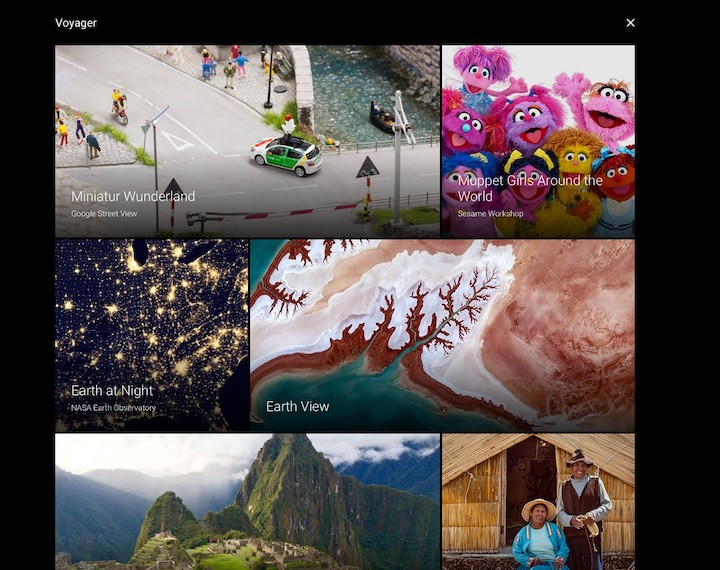

PM: I particularly enjoyed working as an equal partner with Google on the "Google Voyager" project. Google had launched the Voyager platform - based on Google Earth - and we played a major role in the launch of the new platform. Google uses the platform for storytelling. Users not only have access to the globe, but can also explore many stories about our planet. We were tasked with the technical implementation and the content concept. This led to games and quizzes, including our Carmen San Diego project. For the solar eclipse, we built an interactive special. All over the world you could see when and how the eclipse would take place. I also really liked the project with X-Alps. Both projects won the Webby Award.
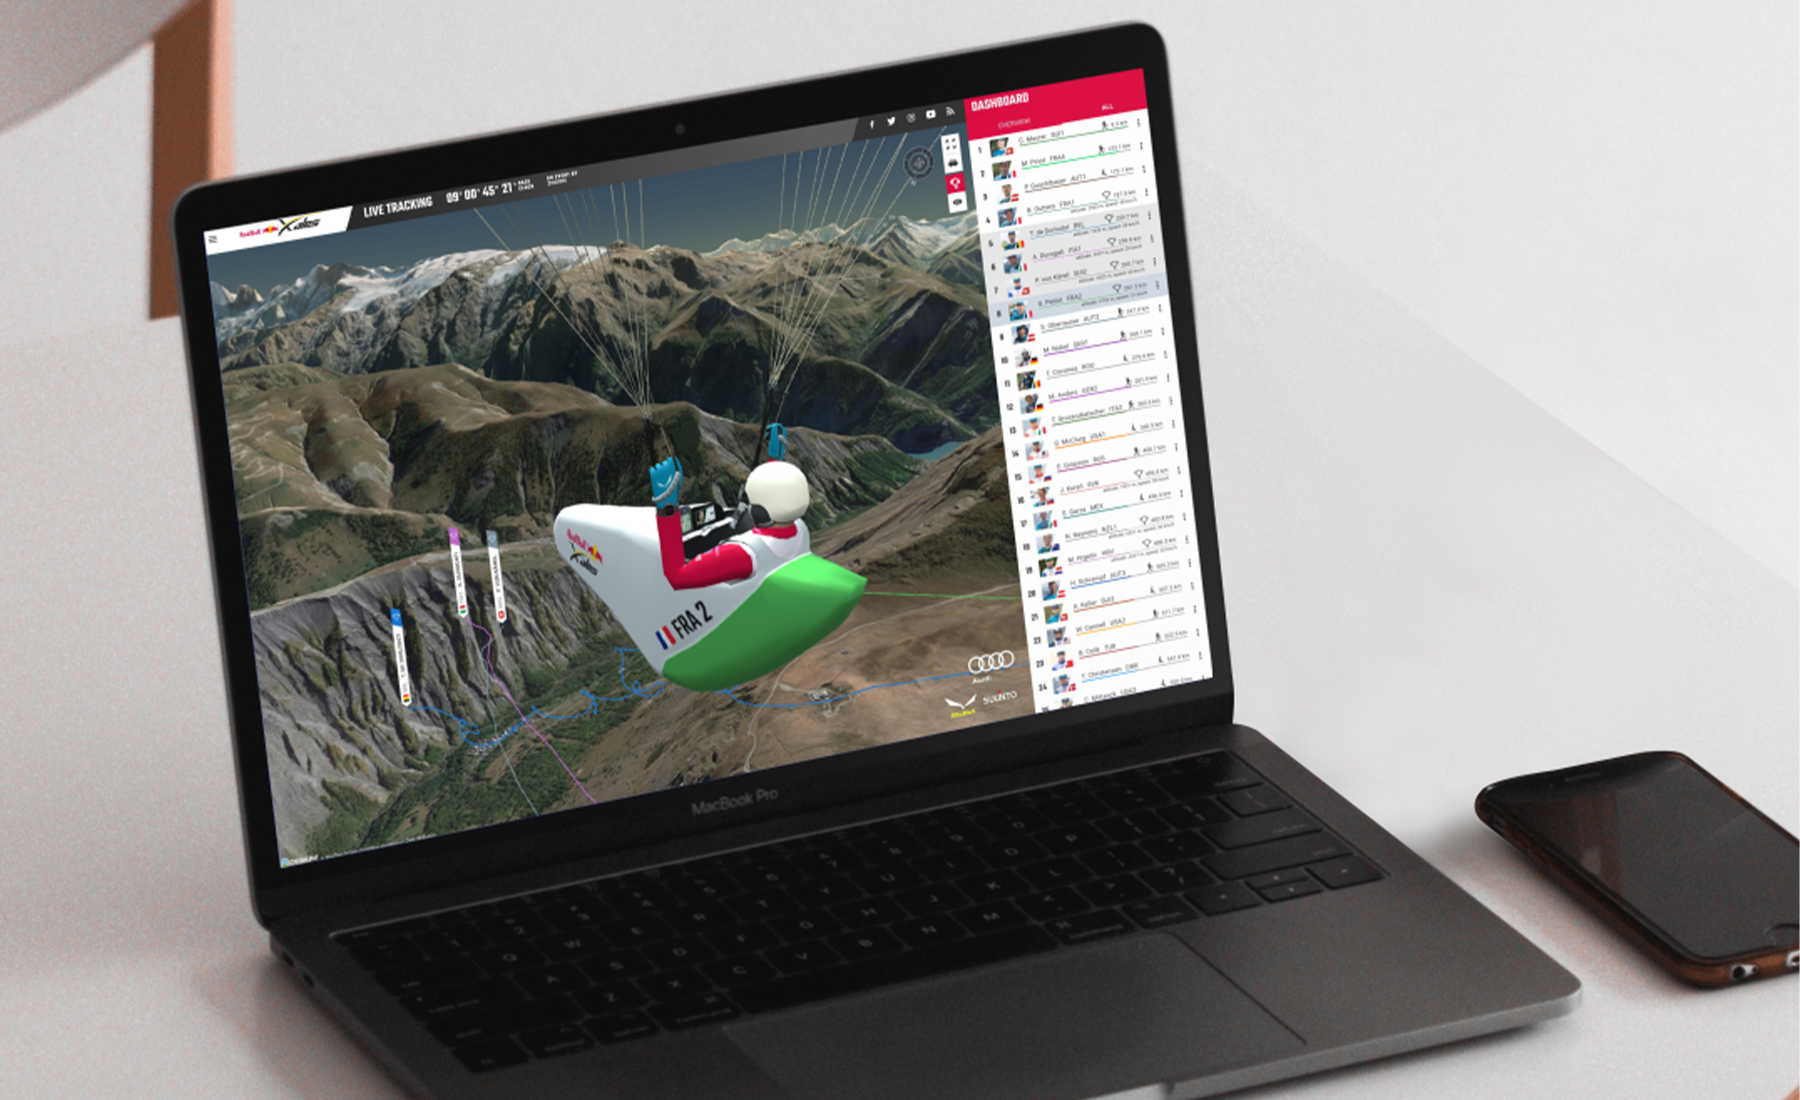
For Red Bull's extreme sports event "X-Alps" we developed a web application through which users could follow the race live and in 3D, with a cockpit mode and wind sounds. A beautiful presentation, live tracking, the map presentation and a competitive element all factored into this exciting project.
AB: I especially liked the "Mokli" project because we support the charity KARUNA in their social work and our solution helps people in need. That's what makes working at Ubilabs so exciting: We develop solutions for large and small customers that appeal to very different user groups. Some applications help selected employees make decisions and others inspire thousands. In the case of Mokli, our application even helps make people's lives easier.